


beginner
Candlestick patterns are an integral part of trading and technical analysis — and the crypto market is no exception. Although it is generally more volatile than its traditional counterparts, the same rules apply here, too.
In this article, we will take a look at the Triple Top reversal chart pattern, its significance, and ways to spot it and trade around it. Let’s dive in!
What Is the Triple Top Bearish Reversal Chart Pattern?
A triple top chart pattern is a bearish candlestick pattern that occurs at the end of an uptrend.
- Bearish: a market characterized by falling/downward price movement.
- Candlestick: a type of chart that displays an asset’s opening, closing, and high and low prices for a predetermined period.
- Uptrend: an overall positive/upwards price movement.
Since it signifies a change from an asset’s price going up to going down, it is considered a bearish reversal pattern.
The triple top pattern is the opposite of the triple bottom pattern, which signals the opposite — a falling price reversing and going up, the beginning of a bullish trend after a downtrend.
Example of a Triple Top Pattern
Here’s what a triple top pattern looks like.
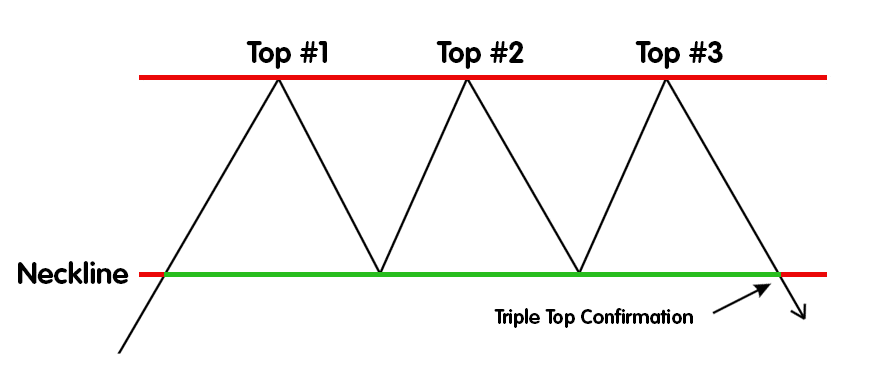
The upper line, the one drawn across the peaks of the chart pattern, is called the horizontal resistance.
How a Triple Top Works
A triple top pattern consists of several different elements:
- An uptrend: An asset’s price should be going up for the triple top pattern to start.
- Three peaks: The price of an asset should attempt to break through the resistance three times and fail, creating three “mountain tops.”
- A neckline: When an asset’s price reverses after the first two peaks, it should hit the support line, which, when broken, will signify the uptrend reversal.
- Horizontal resistance: The trend line that displays the resistance area, the price level that an asset’s price cannot overcome.
The triple top chart pattern occurs when buyers lose their strength as they are unable to break through the resistance line.
There is also a double top chart pattern — it gives the same signal, albeit a weaker one. Three consecutive failures to cross over the resistance price level make buyers hesitant and anxious, drastically reducing the likelihood of the continuation of bullish sentiment.
How to Spot a Triple Top Pattern
When looking for triple top chart patterns out in the wild, don’t get too hung up on the peaks: they are rarely perfectly equal in reality. The horizontal resistance and the neckline are usually a bit slanted.
The three main components of the triple top chart pattern are the initial uptrend, the insurmountable resistance, and the following downtrend. However, how do you spot it before the downtrend — or even all three peaks — appear?
Here’s an example of a triple top pattern for the USD/CAD pair. Notice how there are smaller peaks in between the big ones, and the neckline/resistance level both aren’t perfectly horizontal.
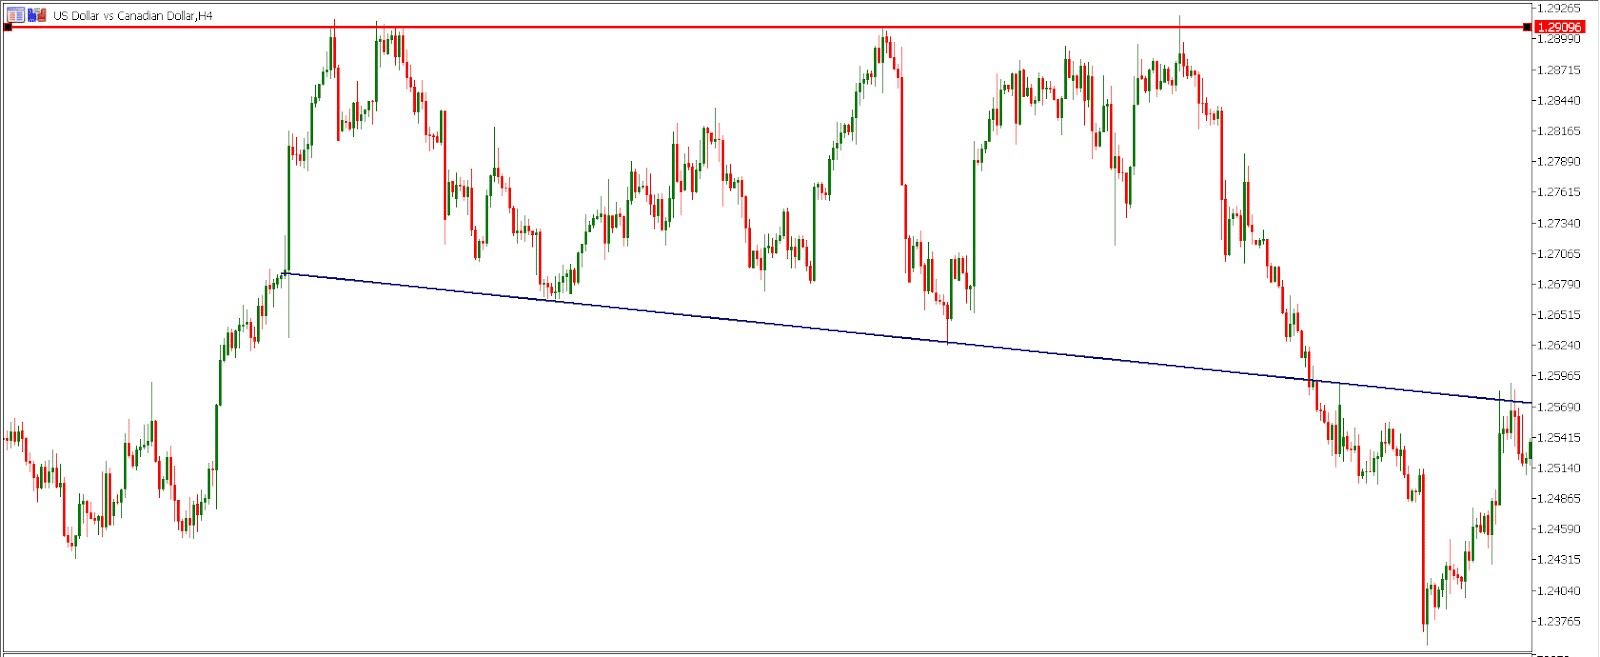
When trying to identify triple top chart patterns before they are fully formed, be wary of mixing them up with double tops. We will talk about entry points in the next section, but for now, it is important to note that trading triple tops before the neckline is broken can be risky. However, you should look out for the peaks after the uptrend and be ready to react.
Trading Triple Top Patterns
As triple top (and similarly, triple bottom) patterns are quite rare, they can be hard to spot and to trade. Here are some tips on how to do it in the most efficient way.
When it comes to entry points, most experts recommend entering triple top trades only after the price breaks through the resistance — as in, when a candle closes below the neckline.
You can enter right at the breakthrough, but this entry point isn’t the safest because the asset can potentially shoot up in price shortly after. Another option is entering as the asset retests the broken neckline — as in, its price approaches the previous resistance level.
Either way, your short position setup will be somewhat similar. In order to minimize risk, you will need to place a stop-loss above the neckline and set a price target equal to the distance between the tops and the neckline.
Mistakes to Avoid When Trading the Triple Top Chart Pattern
Triple top patterns can be quite hard to trade. The first mistake you can make is entering a trade too quickly — while it is possible in some cases, it is very risky. Avoid opening a short position before the pattern is confirmed via the breakthrough.
However, entering too late is also a mistake — at that point, selling pressure will increase by too much and cause the price to stagnate or even rise again. Finding the perfect entry point isn’t easy, but we recommend using stop losses to safeguard yourself and test the waters.
Early trades — ones before the breakdown — can be possible if the trading volume for the third peak is noticeably smaller than that of the other ones. This indicates that buyers have lost their steam.
How to Tell When the Triple Top Chart Pattern Will Fail
As the triple tops can be unreliable, one should know some early signs that can tell us the pattern will fail. Here are the two most common ones.
Higher Highs
If peaks get progressively higher, that means buyers are regaining their strength, and we are unlikely to see any completed reversal chart patterns.
Trading Volume at Peaks and Lows
If the trading volume at the third peak is incredibly high, or at least somewhat higher than that of the other peaks, it signifies that buying pressure is still strong. Additionally, the same goes for the bottom points: if trading volume is higher at the second low point than the first one, more buyers who are ready to push back against the bearish sentiment have joined the market.
Triple Top vs Head and Shoulders Pattern
These two patterns are alike and can yield similar results. Head and shoulders, which is a bearish reversal pattern, also consists of 3 peaks. However, it has one crucial difference: its peaks are uneven, with the middle one being taller than the other two (hence, the pattern’s name).
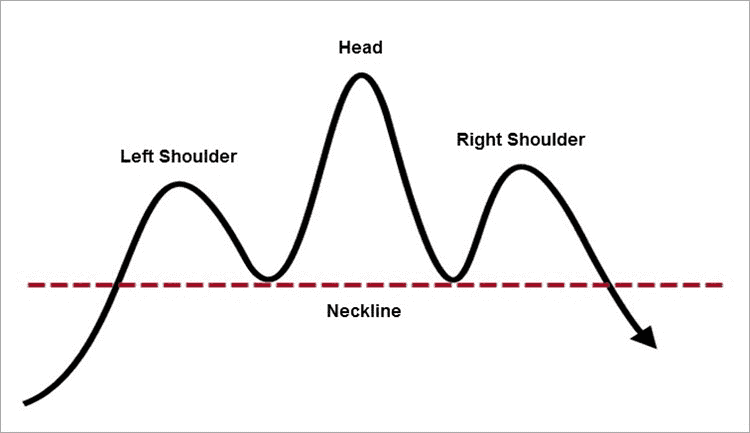
The triple top is considered a more predictable chart pattern: it signals a possible reversal from the second peak. Head and shoulders, on the other hand, still gives bulls some hope during its second peak. As a result, it ends up being more unexpected.
Disclaimer: Please note that the contents of this article are not financial or investing advice. The information provided in this article is the author’s opinion only and should not be considered as offering trading or investing recommendations. We do not make any warranties about the completeness, reliability and accuracy of this information. The cryptocurrency market suffers from high volatility and occasional arbitrary movements. Any investor, trader, or regular crypto users should research multiple viewpoints and be familiar with all local regulations before committing to an investment.